


CoolNUS–BEAM at the National University of Singapore: a campus-scale microclimate digital twin powered by dense weather data
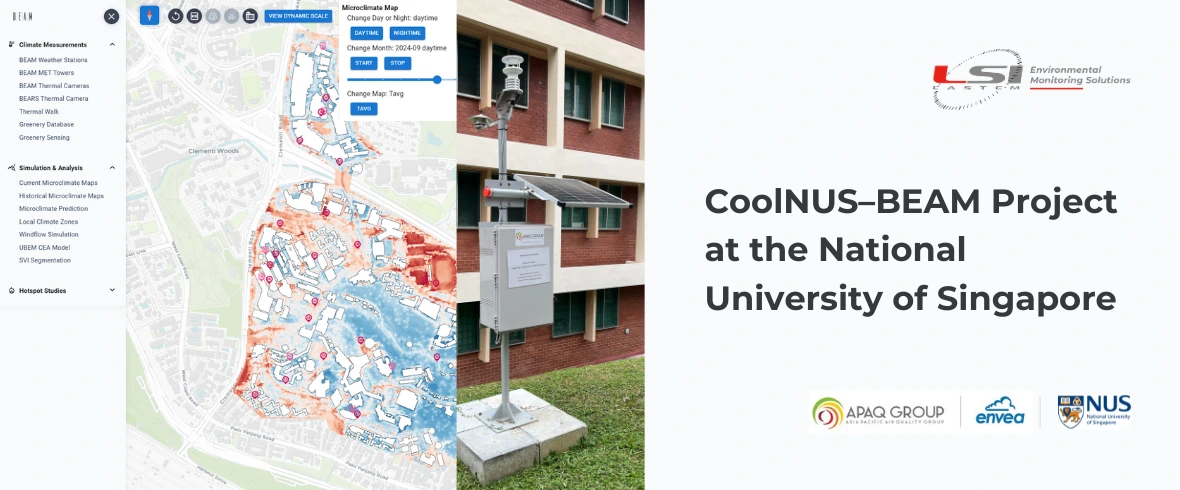
CoolNUS–BEAM is part of the National University of Singapore’s Campus Sustainability Roadmap 2030 (https://sustainability.nus.edu.sg/), a university-wide initiative that sets out concrete actions to build a climate-responsive and resilient campus. Within this framework, the project sits under the “Defend” pillar, focused on protecting the NUS community against climate risks such as rising temperatures and the urban heat island effect (https://uci.nus.edu.sg/campus-sustainability/defend/).
Universities are increasingly becoming “living laboratories” for climate resilience, and NUS is embracing this role through CoolNUS–BEAM: a program designed to measure, understand, and mitigate campus heat at scale. BEAM—Baselining, Evaluating, Action, Monitoring—combines long-term environmental monitoring with a digital twin platform to support evidence-based decisions for a cooler, healthier campus.
As technology provider, LSI LASTEM through APAQ Group-ENVEA (https://www.apaq-group.com/) contributed with the core sensing network that makes this living digital twin possible.
A partnership connecting research and campus operations
One of CoolNUS–BEAM’s strongest assets is the direct collaboration between:
- College of Design and Engineering (CDE), Department of the Built Environment (BE)
- University Campus Infrastructure (UCI)
Researchers design the measurement strategy and convert raw environmental signals into interpretable, decision-ready information, while UCI uses these insights to guide daily operations, management, and long-term investments.
This structure ensures the project doesn’t stay in Academia: it actively supports real operational choices, from landscape planning to building retrofits.
The LSI LASTEM sensing network: high-density monitoring across campus
Capturing microclimate in a complex tropical campus requires many measurement points, not just a few reference stations. BEAM therefore deployed one of Singapore’s densest microclimate networks, enabling fine-grained spatial analyses and robust model validation.
Forty LSI LASTEM weather stations were deployed in the Campus area, 32 on the ground and 8 on buildings’ roofs, each station includes an All-In-One sensor measuring:
- Air temperature
- Relative humidity
- Atmospheric pressure
- Wind speed
- Wind direction
And a pyranometer to measure global solar radiation.
Three of the eight rooftop stations are also equipped with a rain gauge for precipitation measurement.
Installation was completed in early 2024, and the network has already delivered around two years of continuous data, establishing a strong baseline for microclimate trend assessment and pre/post construction comparisons.
The network is completed with three meteorological towers of 15 m height, to capture vertical gradients deploying temperature and humidity sensors every 3 m.
This combination of horizontal density and vertical profiling is essential to understand how heat behaves across different campus morphologies.
From data to action: the open, evolving BEAM platform
All monitoring streams converge into the BEAM open digital platform www.coolnus-beam.sg, where researchers and users can explore:
- Spatially interpolated microclimate maps
- Time-series dashboards
- Microclimatic zones
- Scenario simulations, including pre- and post-construction comparisons
- Results from interconnected research modules
The platform is continuously evolving, both in functionality and in the datasets it hosts. Because it is accessible not only to internal stakeholders but also to researchers, PhD students, and potentially public administrations and other users, it acts as a shared microclimate knowledge base that supports additional research beyond the original scope of the project.
Climate zones: understanding that the campus is not one climate
A key BEAM capability is the identification of multiple campus climate zones — areas with distinct thermal behaviors shaped by:
- Tree coverage
- Building height and spacing
- Pavement and surface materials
- Exposure to wind corridors and solar load
Each zone is characterized with its own data patterns and mitigation priorities. This helps planners and operators understand how strongly microclimate varies from place to place, and why cooling strategies must be site-specific, not one-size-fits-all.
Beyond fixed stations: “Thermal Walks” for pedestrian-scale heat mapping
Among the projects visible on the BEAM platform, a standout is the Thermal Walks campaign. Over three months, researchers repeatedly walked key pedestrian routes using:
- 360° cameras
- Portable weather stations
- Apple Watch with Cozie App.
This produced high-resolution maps of thermal conditions under different times of day and weather scenarios — directly reflecting what people experience while moving through the campus. The campaign was accompanied by questionnaires via Apple Watch to people using the public spaces, to assess the microclimatic comfort of the users. These datasets are fully consultable through the BEAM platform, enriching fixed-station observations with mobility-based microclimate evidence.
Connected research streams: trees, thermal cameras, and cool building envelopes
CoolNUS–BEAM is designed as an ecosystem rather than a single study, integrating additional workstreams such as:
- Thermal imaging to study surface temperature dynamics and hot-spot evolution;
- Campus tree database supporting NUS’s plan to plant 120,000 trees in 10 years, enabling quantification of greenery impact on microclimate;
- Cool paint and solar film pilots, with indoor/outdoor contact temperature sensors on walls and glazing. After successful trials, seven buildings were repainted, confirming measurable benefits for indoor and outdoor thermal conditions.
A non-silo model: shared data, shared progress
Another major strength of this initiative is cultural as much as technical: the project does not work in silos.
Instead, it is structured to let multiple research teams, PhD students, and collaborators use each other’s datasets through the same platform, accelerating discovery and avoiding duplicated measurement efforts. The open architecture means individual projects contribute to a larger whole, and the whole becomes more valuable to every project.
This collaborative logic only works because the environmental backbone is strong — and that returns to one key factor: the high spatial density of measurement points is what turns monitoring into a true campus digital twin.
What’s next: Phase 2 and thermal comfort indices
The researchers have in mind a second phase that would expand sensing to human-comfort metrics, including microclimatic sensors such as black globe and wet bulb thermometers. These would enable the calculation of heat stress and comfort indices, turning raw climate data into direct indicators of how environments feel to people, and how they can be improved outdoors. They also have in mind the developing of an Urban Building Enegy Model (UBEM), a platform that integrates collected local microclimatic data with energy usage profile of NUS buildings.
Conclusion
CoolNUS–BEAM shows what climate adaptation looks like when technology, research, and operations move together under a unified sustainability roadmap. With 40 LSI LASTEM weather stations, three vertical profiling towers, and a growing open digital twin platform enriched by parallel projects, NUS can monitor and simulate campus microclimate with unprecedented detail. We are proud that our instrumentation supports a program that advances science, empowers planners, and makes daily life more comfortable in one of the world’s most climate-challenged urban regions.
Download the article:
FAQ: Frequently Asked Questions
Why is it not sufficient to consider a university campus as a single climatic area?
Because thermal conditions vary depending on the presence of trees, the layout of buildings, surface materials, solar exposure and ventilation. The project therefore makes it possible to identify areas with different needs and to implement targeted measures in each part of the campus.
What is the advantage of combining fixed stations and mobile measurements?
Fixed stations make it possible to monitor microclimate trends over the long term, while mobile measurements provide a more detailed analysis of conditions along pedestrian routes. Combining the two approaches provides a more complete picture of the environmental conditions and people’s actual experience.
Why is vertical profiling important when studying urban heat?
Temperature and humidity conditions vary not only from one location to another, but also with height. Meteorological towers make it possible to observe these vertical gradients and better understand how heat is distributed between the ground, vegetation and buildings.
Why is a digital twin more useful than simply collecting meteorological data?
Because it does not merely store measurements, but also makes it possible to visualise and interpret them and use them to compare different scenarios. It therefore becomes a valuable tool for planning, research and the assessment of interventions.
How can the project contribute to people’s well-being?
The future integration of sensors designed to assess thermal comfort will make it possible to convert environmental data into indicators related to how people perceive heat. This will support the design of more comfortable outdoor spaces and help identify the most critical areas with greater precision.